Hi everyone,
A few weeks ago we talked about clustering with K-Means, and using K-Means distances as a pre-processing step. K-Means is great when euclidean distance in your input feature-space is meaningful, but what if your data instead lies on a high-dimensional manifold?
We recently introduced some new clustering and distance-metric approaches suitable for these cases - spectral clustering. The theory behind spectral clustering is beyond the scope of this entry, but as usual, the wikipedia page has a good summary - http://en.wikipedia.org/wiki/Spectral_clustering.
Although I’m writing the blog entry, all of the code in this demo was written by one of our graduate students @ Duke University - Dmitry Kalika, who’s a new convert to the PRT! Welcome Dima!
Contents
References
Throughout the following and the code for spectral clustering in the PRT, we make use of the excellent Bengio, 2003 paper - Out-of-Sample Extensions for LLE, Isomap, MDS, Eigenmaps, and Spectral Clustering http://www.iro.umontreal.ca/~lisa/pointeurs/tr1238.pdf
In particular, we use that extention for performing cluster approximation for out-of-sample embedding estimation.
prtPreProcSpectralEmbed
Spectral clustering typically relies upon what’s referred to as a spectral embedding; this is a low-dimensional representation of a high-dimensional proximity graph.
We can use features derived from spectral embeddings like so:
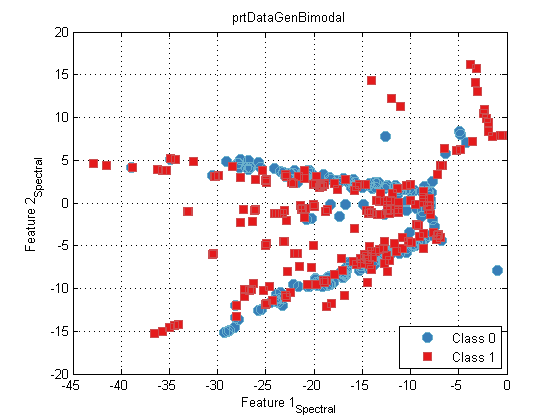
ds = prtDataGenBimodal;
dsTest = prtDataGenBimodal(10);
algo = prtPreProcSpectralEmbed;
algo = algo.train(ds);
yOut = algo.run(ds);
plot(yOut);
prtClusterSpectralKmeans
While spectral embedding provides a feature space for additional processing, we can also use prtClusterSpectralKmeans to perform direct clustering in the spectral space.
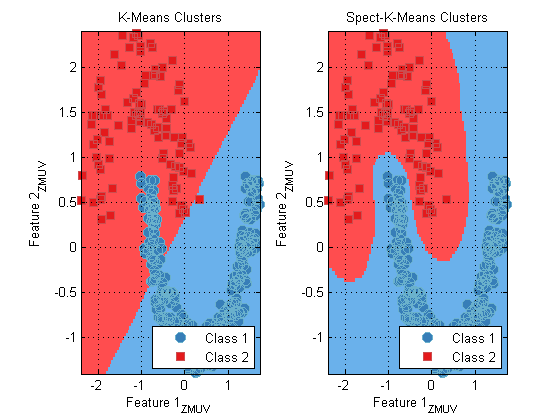
For example, the Moon data set (see prtDataGenMoon) creates two crescent moon-shapes that are not well-separated by euclidean distance metrics, but can be easily separated in spectral-cluster space.
ds = prtDataGenMoon;
preProc = prtPreProcZmuv;
preProc = preProc.train(ds);
dsNorm = preProc.run(ds);
kmeans = prtClusterKmeans(‘nClusters’,2);
kmeansSpect = prtClusterSpectralKmeans(‘nClusters’,2);
kmeans = kmeans.train(dsNorm);
kmeansSpect = kmeansSpect.train(dsNorm);
subplot(1,2,1);
plot(kmeans);
title(‘K-Means Clusters’);
subplot(1,2,2);
plot(kmeansSpect)
title(‘Spect-K-Means Clusters’);
Wrapping Up
Spectral clustering provides a very useful technique for non-linear and non-euclidean clustering. Right now our spectral clustering approaches are constrained to using RBF kernels, though there’s nothing that prevents you from using alternate kernels in future versions.
As always, let us know if you have questions or comments.