Hi everyone, a quick update this time – we added two new prtDataGen* functions to the PRT that people might find useful – prtDataGenSandP500, and prtDataGenCylinderBellFunnel.
Contents
prtDataGenSandP500
prtDataGenSandP500 generates data containing stock-price information from the S&P 500. The information dates back to January 3, 1950, and includes the index’s open, close, volume, and other features.
Check it out:
ds = prtDataGenSandP500;
ds.featureNames
spClose = ds.retainFeatures(5);
plot(spClose.X,'linewidth',2);
title('S&P 500 Closing Value vs. Days since 1/3/1950');
ans =

    'Date'    'Open'    'High'    'Low'    'Close'    'Volume'    'AdjClose'
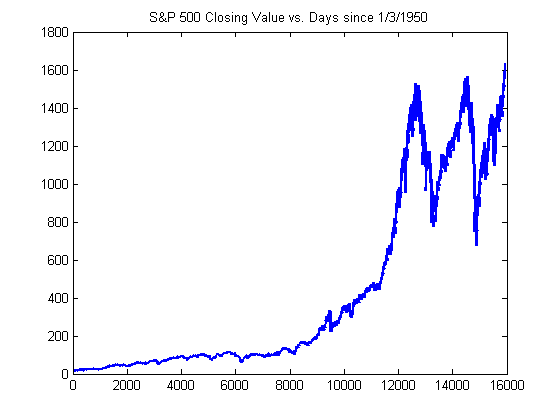
If you can do decent prediction on that data… you might be able to make some money :)
Cylinder-Bell-Funnel
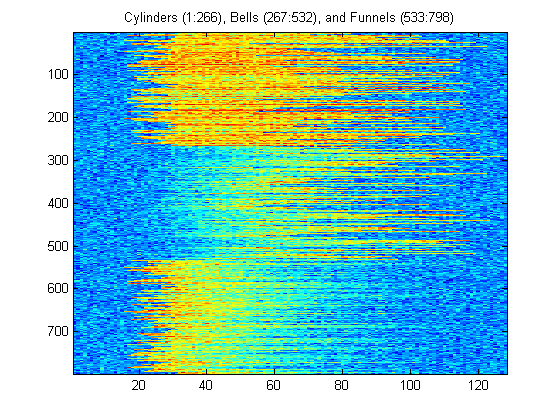
prtDataGenCylinderBellFunnel is a tool for generating a synthetic data set which contains a number of time-series, each of which has either a flat plateau (cylinder), a rising (bell) or a falling (funnel) slope.
You can find the specification we used to generate the data here: http://www.cse.unsw.edu.au/~waleed/phd/html/node119.html
And the data was used in an important paper in the data-mining community – Keogh and Lin, Clustering of Time Series Subsequences is Meaningless: Implications for Previous and Future Research. http://www.cs.ucr.edu/~eamonn/meaningless.pdf
ds = prtDataGenCylinderBellFunnel;
imagesc(ds.X);
title(‘Cylinders (1:266), Bells (267:532), and Funnels (533:798)’);
Conclusion
That’s all for now. Hope you enjoy these new data sets, we’re always adding new data to the PRT; let us know what you’d like to see!