One of the commonly overlooked “actions” in the PRT is prtKernel. They are used internally in several places (RVM, SVM) but they can also be used by themselves. Let’s talk about em.
Contents
Just Another Action
Kernels have very precise meanings in certain contexts (Mercer kernels for example) so it is important that we really define what we mean by prtKernel. A prtKernel is a standard prtAction. That means that it supports the train operation, that takes a dataset and outputs a prtKernel with modified parameters, and the run operation, that takes a dataset and outputs modified dataset. What makes prtKernel different than other prtActions is that they typically transform a dataset into a different dimensionality. The new features are usually the distance to a collection of training examples and most kernels differ in their selection of the distance function. The most widely used kernel is the radial basis function.
Let’s look at using prtKernelRbf.
ds = prtDataGenBimodal;
kernel = prtKernelRbf('sigma',2); % Set the kernel Parameter
trainedKernel = kernel.train(ds); % Train the kernel using the input data
kernelTransformedData = trainedKernel.run(ds);

subplot(2,1,1)
plot(ds);
subplot(2,1,2)
imagesc(kernelTransformedData.X);
colormap(hot)
title('Kernel Transformation');
ylabel('observation');
xlabel('feature')
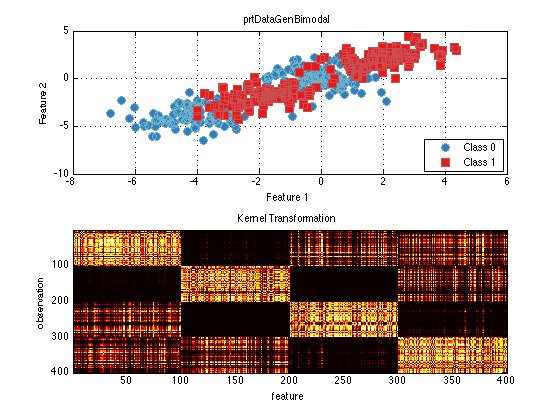
You can see in the image space that there is a checkerboard pattern highlighting the multi-modal nature of the data.
Let’s see what some other kernel transformations look like.
kernelRbf = prtKernelRbf(‘sigma’,2); trainedKernelRbf = kernelRbf.train(ds); kernelTransformedDataRbf = trainedKernelRbf.run(ds);subplot(2,2,1) imagesc(kernelTransformedDataRbf.X); title(‘RBF Kernel Transformation’); ylabel(‘observation’); xlabel(‘feature’)
kernelHyp = prtKernelHyperbolicTangent; trainedKernelHyp = kernelHyp.train(ds); kernelTransformedDataHyp = trainedKernelHyp.run(ds);
subplot(2,2,2) imagesc(kernelTransformedDataHyp.X); title(‘Hyperbolic Tangent Kernel Transformation’); ylabel(‘observation’); xlabel(‘feature’)
kernelPoly = prtKernelPolynomial; trainedKernelPoly = kernelPoly.train(ds); kernelTransformedDataPoly = trainedKernelPoly.run(ds);
subplot(2,2,3) imagesc(kernelTransformedDataPoly.X); title(‘Polynomial Kernel Transformation’); ylabel(‘observation’); xlabel(‘feature’)
kernelDirect = prtKernelDirect; trainedKernelDirect = kernelDirect.train(ds); kernelTransformedDataDirect = trainedKernelDirect.run(ds);
subplot(2,2,4) imagesc(kernelTransformedDataDirect.X); title(‘Direct Kernel Transformation’); ylabel(‘observation’); xlabel(‘feature’)
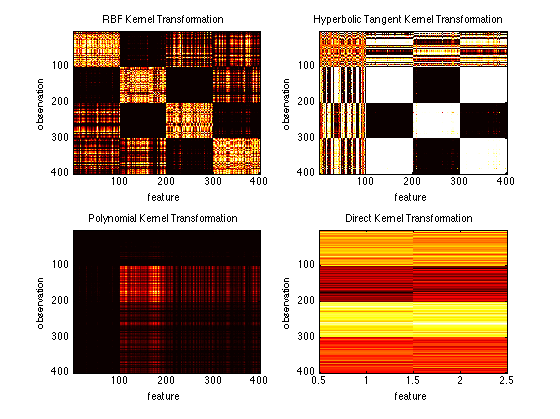
You can see how the choice of the kernel (and kernel parameters) can really effect the outcoming feature space. It is also interesting to notice that the direct kernel is not actually a kernel at all. It just uses the data as the output featurespace (essentially doing nothing). This is useful for combining the original feature space with kernel transformed data using kernel sets.
Kernel Sets
Kernels can be combined using the & operator to great prtKernelSets. These perform collumn wise concatonation of several kernels. This allows one to create a single kernel transformation out of several prtKernels. In theory one could use / to make a parallel prtAlgorithm to accomplish the same task but there are several reasons to use & that allow them to work within the prtClassRvm and prtClassSvm to remain efficient at run-time.
clf; % Clear those subplots from earlier
kernel = prtKernelDc & prtKernelRbf(‘sigma’,1) & prtKernelHyperbolicTangent;
trainedKernel = kernel.train(ds); % Train the kernel using the input data
kernelTransformedData = trainedKernel.run(ds);
imagesc(kernelTransformedData.X);
title(‘A Kernel Set Transformation’);
ylabel(‘observation’);
xlabel(‘feature’)
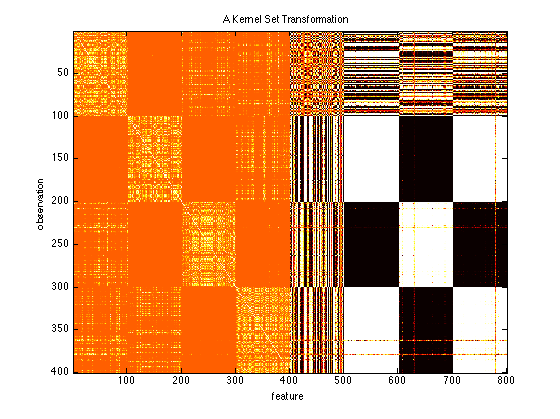
You can see that the different transformed feature spaces are concatenated together.
Inside the RVM
In prtClassRvm the “kernels” property can be set to the prtKernel of our choosing. The RVM is essentially a sparse (it tries to have most coefficients be zero) linear classifier that opperates on kernel transformed data. Let’s look at some classification results of prtDataGenBimodal using several different choices for the kernel.
subplot(2,2,1) plot(train(prtClassRvm(‘kernels’,prtKernelRbf(‘sigma’,2)),ds)) title(‘RBF Kernel RVM’);subplot(2,2,2) plot(train(prtClassRvm(‘kernels’,prtKernelHyperbolicTangent),ds)) title(‘Hyperbolic Tangent Kernel RVM’);
subplot(2,2,3) plot(train(prtClassRvm(‘kernels’,prtKernelPolynomial),ds)) title(‘Polynomial Kernel RVM’);
subplot(2,2,4) plot(train(prtClassRvm(‘kernels’,prtKernelDirect),ds)) title(‘Direct Kernel RVM’);
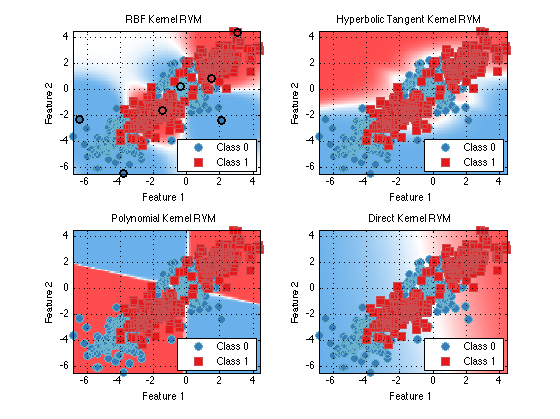
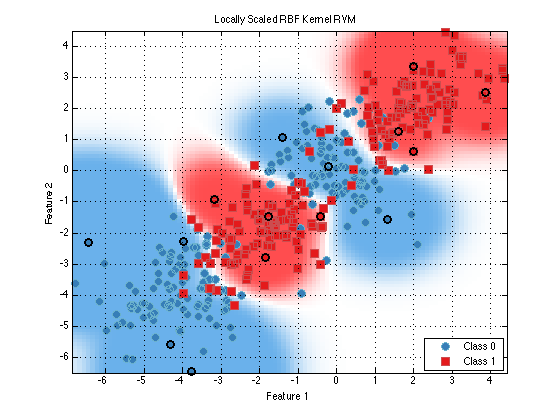
As you can see the correct choice for the kernel is very important for robust classifcation. The RBF kenerl is a common choice but even it has the sigma parameter which can grealy impact performance. One interesting variant of the RBF kernel is call prtKernelRbfNeighborhoodScaled. This kernel sets the sigma parameter differently for each data point depending on the local neighborhood of the training point.
clf; % Clear those subplots from earlier
plot(train(prtClassRvm(‘kernels’,prtKernelRbfNeighborhoodScaled),ds))
title(‘Locally Scaled RBF Kernel RVM’);
Outside of the RVM
In the forum the other day someone asked if we could do non-linear regression with multi-dimensional output. Sadly, the answer is “not directly” but using kernels you can. By transforming the data to kernel space and then using a linear regression technique you can perform non-linear regression. I wont copy the content over here but check out the answer from the forum. http://www.newfolderconsulting.com/node/412
Conclusions
This was a pretty quick overview of things you can do with kernels in the PRT. We don’t have every kernel but we have quite a few. If there is something you think we should add let us know.