In the last entry, we introduced a data set - the Cylinder-Bell-Funnel data set, prtDataGenCylinderBellFunnel. To visualize it easily, we used the MATLAB function imagesc, which makes an image out of the data, with automatically determined colormap settings. Today we’ll expand on that, and make the process a lot easier.
Contents
Example
For a lot of high-dimensional data sets, it turns out creating an observations x features image of the data is a great way to visualize and understand your data. This week we made that process a little easier and cleaner by introducing a method of prtDataSetClass - imagesc.
The method takes care of a number of things that were a little tricky to do previously - first, it makes sure the observations are sorted by class index, next it creates an image of all the data with black bars denoting the class boundaries, and finally, it makes the y-tick-marks contain the relevant class names.
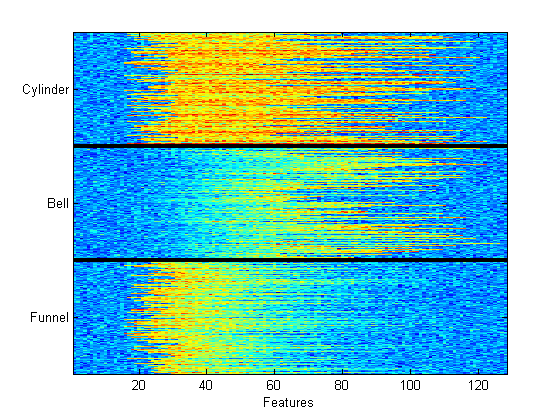
It’s now easy to generate clean visualizations like so:
ds = prtDataGenCylinderBellFunnel;
ds.imagesc;
Other Data Sets
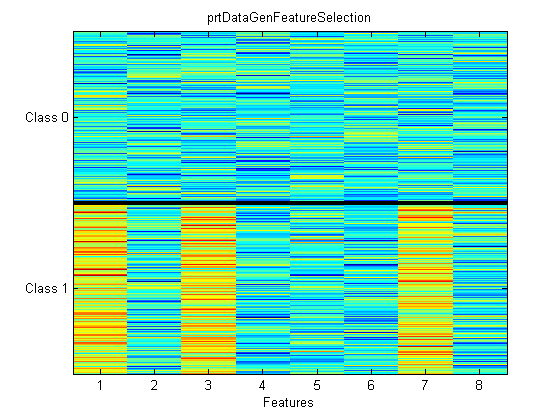
Of course, you can do the same thing with other data sets, too. Look at how easy it is to see which features are important in prtDataGenFeatureSelection:
ds = prtDataGenFeatureSelection;
ds.imagesc;
Wrapping Up
That’s it for this week. We use imagesc-based visualization all the time, and hopefully you’ll find it interesting and useful, too.