Datasets in the Pattern Recognition Toolbox
Before you can perform any actions with the PRT, your data must be stored in a PRT dataset object.
There are 3 basic types of dataset objects, prtDataSetStandard, prtDataSetClass, and prtDataSetRegress. The prtDataSetStandard object is a generic object, containing much of the functionality needed to work with the PRT. In general however, you will probably want to work with either prtDataSetClass, or prtDataSetRegress, depending on if you are interested in classification or regression, respectively. All prtDataSet objects inherit from the prtDataSetBase class, which provides most of the basic functionality for setting and getting data members. For more information on the base data class, see prtDataSetBase.
Contents
prtDataSetStandard
prtDataSetStandard objects can hold either labeled or unlabled data. To create am empty prtDataSetStandard object, you can use the following command:
ds = prtDataSetStandard
ds =
  prtDataSetStandard

  Properties:
            nFeatures: 0
          featureInfo: []
                 data: []
              targets: []
        nObservations: 0
    nTargetDimensions: 0
            isLabeled: 0
      observationInfo: []
                 name: ''
          description: ''
             userData: [1x1 struct]
The resulting object has no observations (nObservations = 0), no features, and is not labeled. To assign some observations, you can use the following command:
ds = ds.setX([1; 2; 3])
ds =
  prtDataSetStandard

  Properties:
            nFeatures: 1
          featureInfo: []
                 data: [3x1 double]
              targets: []
        nObservations: 3
    nTargetDimensions: 0
            isLabeled: 0
      observationInfo: []
                 name: ''
          description: ''
             userData: [1x1 struct]
This result of this command illustrates a few very important features of the PRT to remember. First, since prtDataSets are not MATLAB handle objects, if you want to set the data or label properties, you need to say ds = ds.setX([1;2;3]). If you just say ds.setX([1;2;3]), then the result will be returned and stored in the ans variable, and the original ds object will be unchanged.
The second important feature this command illustrates is the orientation of observations and features. Note that ds is now an object with 3 observations, since we passed setX a 3x1 column vector. So, each row of the observation vector corresponds to a single observation. Each observation can have multiple features, where each column corresponds to a different feature. For example:
ds = ds.setX([1 2; 3 4; 5 6])
ds =
  prtDataSetStandard

  Properties:
            nFeatures: 2
          featureInfo: []
                 data: [3x2 double]
              targets: []
        nObservations: 3
    nTargetDimensions: 0
            isLabeled: 0
      observationInfo: []
                 name: ''
          description: ''
             userData: [1x1 struct]
ds is now a prtDataSetStandard object with 3 observations, and 2 features per observation. The first observation, feature 1 equals 1, feature 2 equals 2, etc.
Right now, the dataset is not labeled. To set labels, we can use the setY (or setTargets) function. Suppose we want to simply label the data as being a member of class 0 or class 1, you can do the following:
ds = ds.setY([1;0;1])
ds =
  prtDataSetStandard

  Properties:
            nFeatures: 2
          featureInfo: []
                 data: [3x2 double]
              targets: [3x1 double]
        nObservations: 3
    nTargetDimensions: 1
            isLabeled: 1
      observationInfo: []
                 name: ''
          description: ''
             userData: [1x1 struct]
Note that the number of targets was equal to the number of observations. This must be so, or else the setTargets function will error. You should also see that the object is now labeled (isLabeled = 1), and the number of target dimensions equals 1. In general, if your number of target dimensions equals 1, then you are likely performing a classification, and you should use the prtDataSetClass object. If your number of target dimensions is greater than 1, you should probably be using the prtDataSetRegress object.
Finally, note that the ds object has fields observationInfo, and featureInfo. These fields are to store whatever other information about the observations or features that you might wish to carry around. For example:
ds = ds.setObservationInfo('info1',[7 8 9]')
ds =
  prtDataSetStandard

  Properties:
            nFeatures: 2
          featureInfo: []
                 data: [3x2 double]
              targets: [3x1 double]
        nObservations: 3
    nTargetDimensions: 1
            isLabeled: 1
      observationInfo: [3x1 struct]
                 name: ''
          description: ''
             userData: [1x1 struct]
Assigns a structure with 1 field named 'info1', where the value 7 corresponds to observation 1, etc. The same functionality works for features:
ds = ds.setFeatureInfo('featInfo1', [11 12]')
ds =
  prtDataSetStandard

  Properties:
            nFeatures: 2
          featureInfo: [1x2 struct]
                 data: [3x2 double]
              targets: [3x1 double]
        nObservations: 3
    nTargetDimensions: 1
            isLabeled: 1
      observationInfo: [3x1 struct]
                 name: ''
          description: ''
             userData: [1x1 struct]
Where the value 11 corresponds to feature 1. Note, in general, it is not required to use the observationInfo or featureInfo fields. They just exist in case you have additional data that you wish to carry around, but do not necessarily want it to be processed by any of the PRT functions.
prtDataSetClass
The prtDataSetClass object is an extension of the prtDataSetStandard, with several additional properties and methods specific to data that is to be used for classification. All PRT classification objects require prtDataSetClass object for training and running. To illustrate, load a binary dataset using the funcion prtDataGenUnimodal:
ds = prtDataGenUnimodal
ds =
  prtDataSetClass

  Properties:
               nFeatures: 2
             featureInfo: []
                    data: [400x2 double]
                 targets: [400x1 double]
           nObservations: 400
       nTargetDimensions: 1
               isLabeled: 1
         observationInfo: []
                    name: 'prtDataGenUnimodal'
             description: ''
                userData: [1x1 struct]
                nClasses: 2
           uniqueClasses: [2x1 double]
    nObservationsByClass: [2x1 double]
              classNames: {2x1 cell}
                 isUnary: 0
                isBinary: 1
                  isMary: 0
               isZeroOne: 1
            hasUnlabeled: 0
prtDataGenUnimodal randomly generates a dataset with 2 classes, with 2 dimensions, and 200 observations per class. Note the additional properties such as nClasses, which equals 2. isBinary is therefore set to true because it is a binary data set. Since this dataset has 2 dimensions, it can be plotted with the following command:
ds.plot
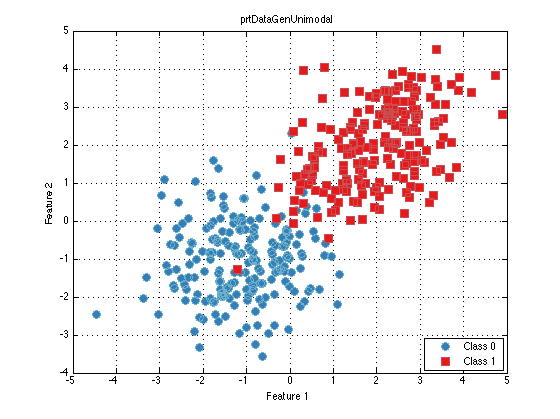
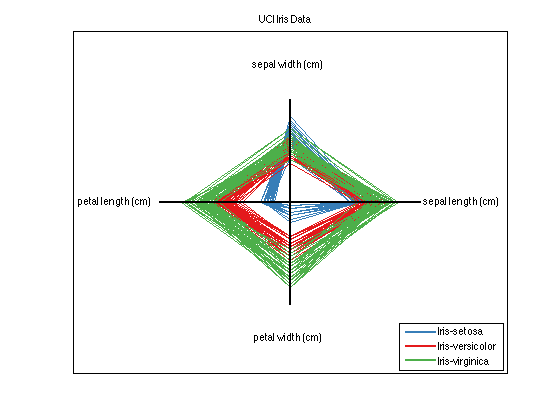
When a dataset has 3 or fewer dimensions, it can be plotted on a scatterplot in this manner. When the dataset has more than 3 dimensions, the PRT provides several ways for visualizing the data, such as the PRT explorer, or methods such as plotStar, plotAsTimeSeries, plotPairs. For an example of a higher dimension prtDataSetClass, load the Iris dataset:
ds = prtDataGenIris
ds =
  prtDataSetClass

  Properties:
               nFeatures: 4
             featureInfo: []
                    data: [150x4 double]
                 targets: [150x1 double]
           nObservations: 150
       nTargetDimensions: 1
               isLabeled: 1
         observationInfo: []
                    name: 'UCI Iris Data'
             description: ''
                userData: [1x1 struct]
                nClasses: 3
           uniqueClasses: [3x1 double]
    nObservationsByClass: [3x1 double]
              classNames: {3x1 cell}
                 isUnary: 0
                isBinary: 0
                  isMary: 1
               isZeroOne: 0
            hasUnlabeled: 0
This dataset has 4 classes, and 4 features per class. The isMary property is therefore set to true. Experiment with the different ways to visualize this dataset. For example, try the plotStar function:
ds.plotStar
For more information on the prtDataSetClass, please refer to prtDataSetClass
prtDataSetRegress
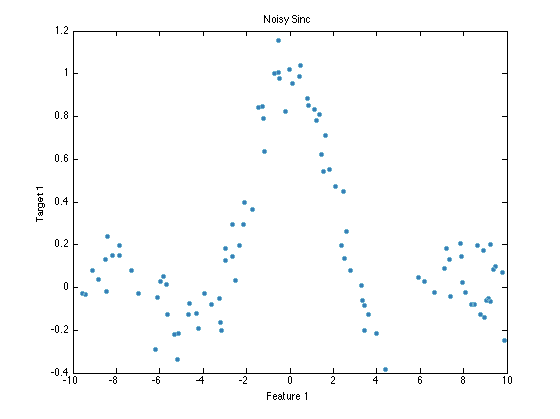
prtDataSetRegress is also an extension of prtDataSetStandard, with methods overloaded with functionality specific to plotting regression data. All PRT classification objects require prtDataSetClass object for training and running. For example, load a regression data set, and plot it:
ds = prtDataGenNoisySinc
ds.plot
ds =
  prtDataSetRegress

  Properties:
            nFeatures: 1
          featureInfo: []
                 data: [100x1 double]
              targets: [100x1 double]
        nObservations: 100
    nTargetDimensions: 1
            isLabeled: 1
      observationInfo: []
                 name: 'Noisy Sinc'
          description: ''
             userData: [1x1 struct]
For more information on prtDataSetRegress, please refer to prtDataSetRegress