PRT Blog

MATLAB Pattern Recognition Open Free and Easy

PRT Logo

Pattern Recognition in MATLAB

The Pattern Recognition Toolbox for MATLAB® provides an easy to use and robust interface to dozens of pattern classification tools making cross-validation, data exploration, and classifier development rapid and simple. The PRT gives you the power to apply sophisticated data analysis techniques to your problem. If you have data and need to make predictions based on your data, the PRT can help you do more in less time.

Visualize Your Data

The PRT’s prtDataSet objects make using and visualizing your data a breeze. The multiple built in techniques for data visualization will help you interactively understand your data and develop the insights to help you make breakthroughs.

Streamline Your Processing

The PRT provides a wide array of inter-connectable pattern recognition approaches. Every PRT action can be connected to any other PRT actions to enable you to build the powerful processing pipelines to solve the problems you need to solve with a single tool.

Get Answers

Built in cross-validation techniques ensure that your performance estimates are robust, and are indicative of expected operating performance, and built in support for decision making takes the guesswork out of setting optimal thresholds to make binary or M-ary decisions based on your data.


Latest Post


New Visualization With IMAGESC

In the last entry, we introduced a data set - the Cylinder-Bell-Funnel data set, prtDataGenCylinderBellFunnel. To visualize it easily, we used the MATLAB function imagesc, which makes an image out of the data, with automatically determined colormap settings. Today we’ll expand on that, and make the process a lot easier.

Contents

Example

For a lot of high-dimensional data sets, it turns out creating an observations x features image of the data is a great way to visualize and understand your data. This week we made that process a little easier and cleaner by introducing a method of prtDataSetClass - imagesc.

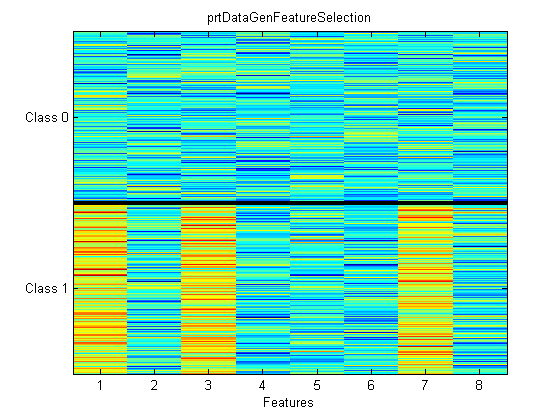
The method takes care of a number of things that were a little tricky to do previously - first, it makes sure the observations are sorted by class index, next it creates an image of all the data with black bars denoting the class boundaries, and finally, it makes the y-tick-marks contain the relevant class names.

It’s now easy to generate clean visualizations like so:

ds = prtDataGenCylinderBellFunnel;
ds.imagesc;

Other Data Sets

Of course, you can do the same thing with other data sets, too. Look at how easy it is to see which features are important in prtDataGenFeatureSelection:

ds = prtDataGenFeatureSelection;
ds.imagesc;
Wrapping Up

That’s it for this week. We use imagesc-based visualization all the time, and hopefully you’ll find it interesting and useful, too.