Hi everyone,
Today we’d like to talk about using K-Means as a non-linear feature extraction algorithm. This is becoming a pretty popular way to deal with a number of classification tasks, since K-means followed by linear classification is relatively easy to paralellize and works well on very large data sets.
We’ll leave the large data set processing to another time, and for now, just look at a new prtPreProc object - prtPreProcKmeans
Contents
prtPreProcKmeans
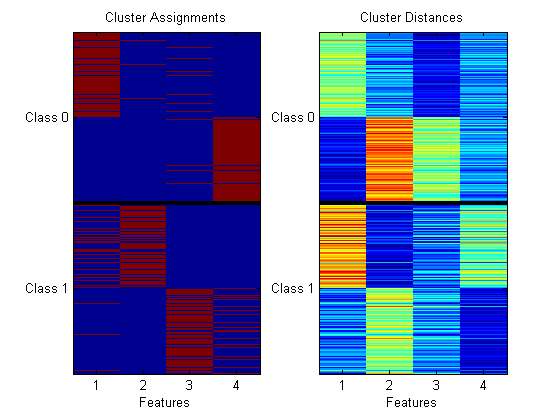
You may be used to using prtClusterKmeans previously, and wonder why we need prtPreProcKmeans - the answer is a little subtle. prtCluster* objects are expected to output the max a-posteriori cluster assignments. But for feature extraction, we actually want to output the distances from each observation to each cluster center (vs. the class outputs). You can see the difference in the following:
ds = prtDataGenBimodal;
cluster = prtClusterKmeans('nClusters',4);
preProc = prtPreProcKmeans('nClusters',4);

cluster = cluster.train(ds);
preProc = preProc.train(ds);
dsCluster = cluster.run(ds);
dsPreProc = preProc.run(ds);

subplot(1,2,1);
imagesc(dsCluster);
title('Cluster Assignments');
subplot(1,2,2);
imagesc(dsPreProc);
title('Cluster Distances');

Combining with Linear Classification
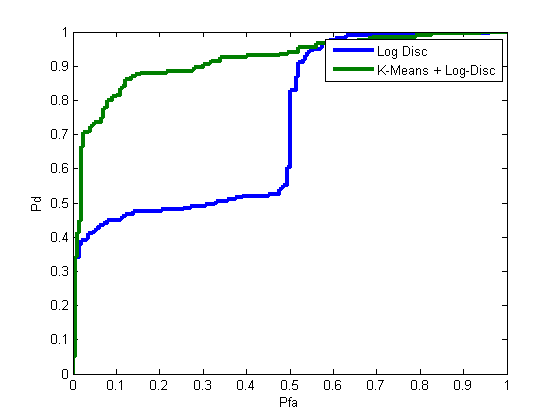
We can combine prtPreProcKmeans with any classifier – let’s try with a logistic discriminant, and see how well we can do:
algoSimple = prtClassLogisticDiscriminant; algoKmeans = prtPreProcKmeans(‘nClusters’,4) + prtClassLogisticDiscriminant;yOutSimple = kfolds(algoSimple,ds,5); yOutKmeans = kfolds(algoKmeans,ds,5);
yOutAll = catFeatures(yOutSimple,yOutKmeans); [pf,pd] = prtScoreRoc(yOutAll); subplot(1,1,1); h = prtUtilCellPlot(pf,pd); set(h,‘linewidth’,3); legend(h,{‘Log Disc’,‘K-Means + Log-Disc’}); xlabel(‘Pfa’); ylabel(‘Pd’);

Visualizing
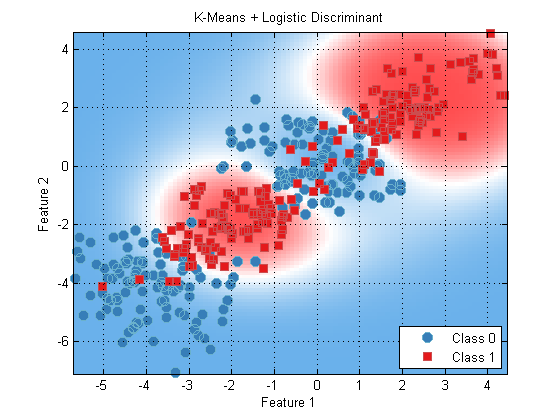
We can visualize the resulting decision boundary using a hidden (and undocumented method) of prtAlgorithm, that lets us plot algorithms as though they were classifiers as long as certain conditions are met.
Here’s an example:
algoKmeans = algoKmeans.train(ds);
algoKmeans.plotAsClassifier;
title(‘K-Means + Logistic Discriminant’);

Wrapping Up
K-Means pre-processing is a potentially powerful way to combine simple clustering and simple classification algorithms to form powerful non-linear classifiers.
We’re working on some big additions to the PRT in the next few weeks… especially dealing with very large data sets. Stay tuned.