Evaluating results using scoring functions in the PRT
The Pattern Recognition Toolbox offers several functions for evaluating your results. The functions described in this section all operate on PRT data sets, generally these will be the data sets returned from a classification, clustering or regression operation.
Contents
Binary scoring functions
The first set of scoring functions work on binary data, to evaluate percent error, plot receiver operating curves and similar operations. In the following example, a simple binary classifier is created and scored
ds = prtDataGenUnimodal;    % Load a binary data set
class = prtClassGlrt;       % Create a classifier.
result = class.kfolds(ds,3);% Perform a k-fold validation, score the result

prtScoreRoc(result);         % Plot the receiver operating curve
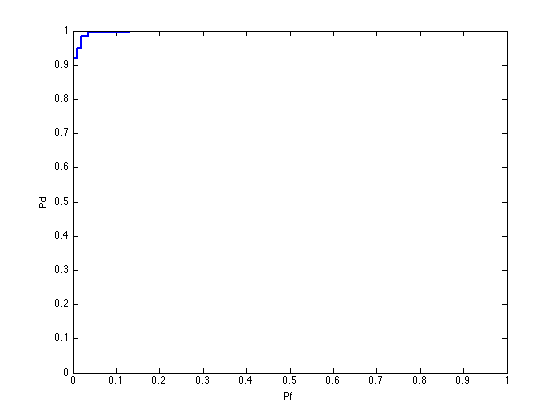
Related to the receiver operating curve, another useful metric is the area under the ROC curve, which can be computed using prtScoreAuc:
auc = prtScoreAuc(result)
auc =
    0.9980
Note, in the above example, the data stored in result are decision statistics. By setting the decision rule, you can compute a percent correct:
class.internalDecider = prtDecisionBinaryMinPe;  % Set the internal decider
result = class.kfolds(ds,3);                     % K-folds validation

prtScorePercentCorrect(result)                % Compute the percent correct
ans =
    0.9725
Recall that when a PRT class object is run or cross-validated, the output is stored in the observations of the resulting dataset, and the class labels, if present, are copied and stored in the tagets of the resulting dataset. When prtScorePercentCorrect is called on a data set, these two fields are compared.
Another common method of scoring is to evaluate the cost vector for a set of decision statistics. First, clear the internal decider, then perform cross-validation again. Finally, evaluate the decision statistics for a particular cost matrix using the prtScoreCost function:
class.internalDecider = [];
result = class.kfolds(ds,3);
costMatrix = [0 1; 2 0];  % Define a cost matrix. This cost structure makes
                          % deciding H1 when H0 is truth twice as costly as
                          % deciding H0 when H1 is truth.

%prtScoreCost(result, costMatrix)
cost = prtScoreCost(result.getX, result.getY, costMatrix);
Scoring M-ary classifiers
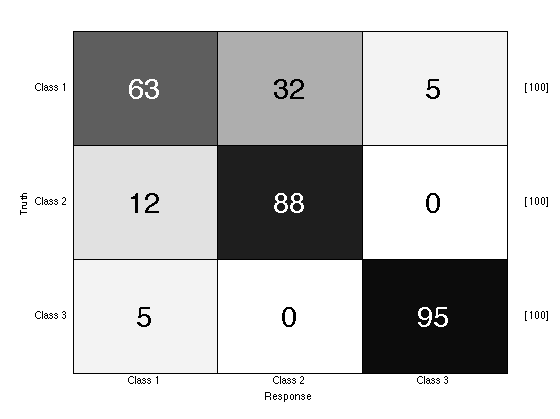
To score M-ary classifier, you can again use the prtScorePercentCorrect function. In addition, it is often useful to plot the confusion matrix Consider the following example:
ds = prtDataGenMary;        % Load a data set
class = prtClassMap;        % Create an M-ary classifier
% Set the internal decider
class.internalDecider = prtDecisionMap;

result = class.kfolds(ds,3);   % Perform K-folds validation

prtScoreConfusionMatrix(result);
prtScorePercentCorrect(result)
ans =
    0.8200
Scoring regression algorithms
To score regression algorithms, use the prtScoreRmse function. Consider the following example:
dataSet = prtDataGenNoisySinc;   % Load a prtDataRegress data set, a
                                 % noisy Sinc function
reg = prtRegressRvm;             % Create a prtRegressRvm object
reg = reg.train(dataSet);        % Train the prtRegressRvm object
dataSetOut = reg.run(dataSet);   % Run the regressor on the data

% Compute the truth and the guess and evaluate:
truth = sinc(dataSet.getX);
guess = dataSetOut.getX;
prtScoreRmse(truth, guess)
ans =
    0.3941
All scoring functions in the Pattern Recognition Toolbox have the same API as discussed above. The difference is in the performance metric to be evaluated. For a list of all the different functions, and links to their individual help entries, A list of commonly used functions